
Profiling that returns data, not a report
dataxid-profiling analyzes every column with Polars and hands back typed statistics, quality alerts, and correlations you can read in code — plus an HTML report when a human needs to look.
pip install dataxid-profiling- PyPI
- Apache-2.0
- Python 3.10+
import polars as pl
from dataxid_profiling import ProfileReport

df = pl.read_csv("data.csv")
report = ProfileReport(df)
report.to_html("report.html")The profile is an object, not a file
Every number in the report is available as a typed Python value — indexable, serializable, and testable without ever parsing HTML.
- report.stats gives you a dictionary per column: counts, distributions, distinct values, and the histogram behind every chart
- report.alerts returns typed Alert objects carrying an AlertType enum, not formatted strings
- report.correlations returns matrices you can index, diff, and assert on
- to_dict, to_json, and to_html are three renderings of one result — none of them is the source of truth
report = ProfileReport(df, title="Customer Data Profile")

# the whole profile as a plain dictionary
stats = report.to_dict()

# typed Alert objects, not formatted strings
alerts = report.alerts

# one column at a time
column_stats = report.stats["age"]

# correlation matrices, keyed by method
correlations = report.correlationsEvery column type, measured properly
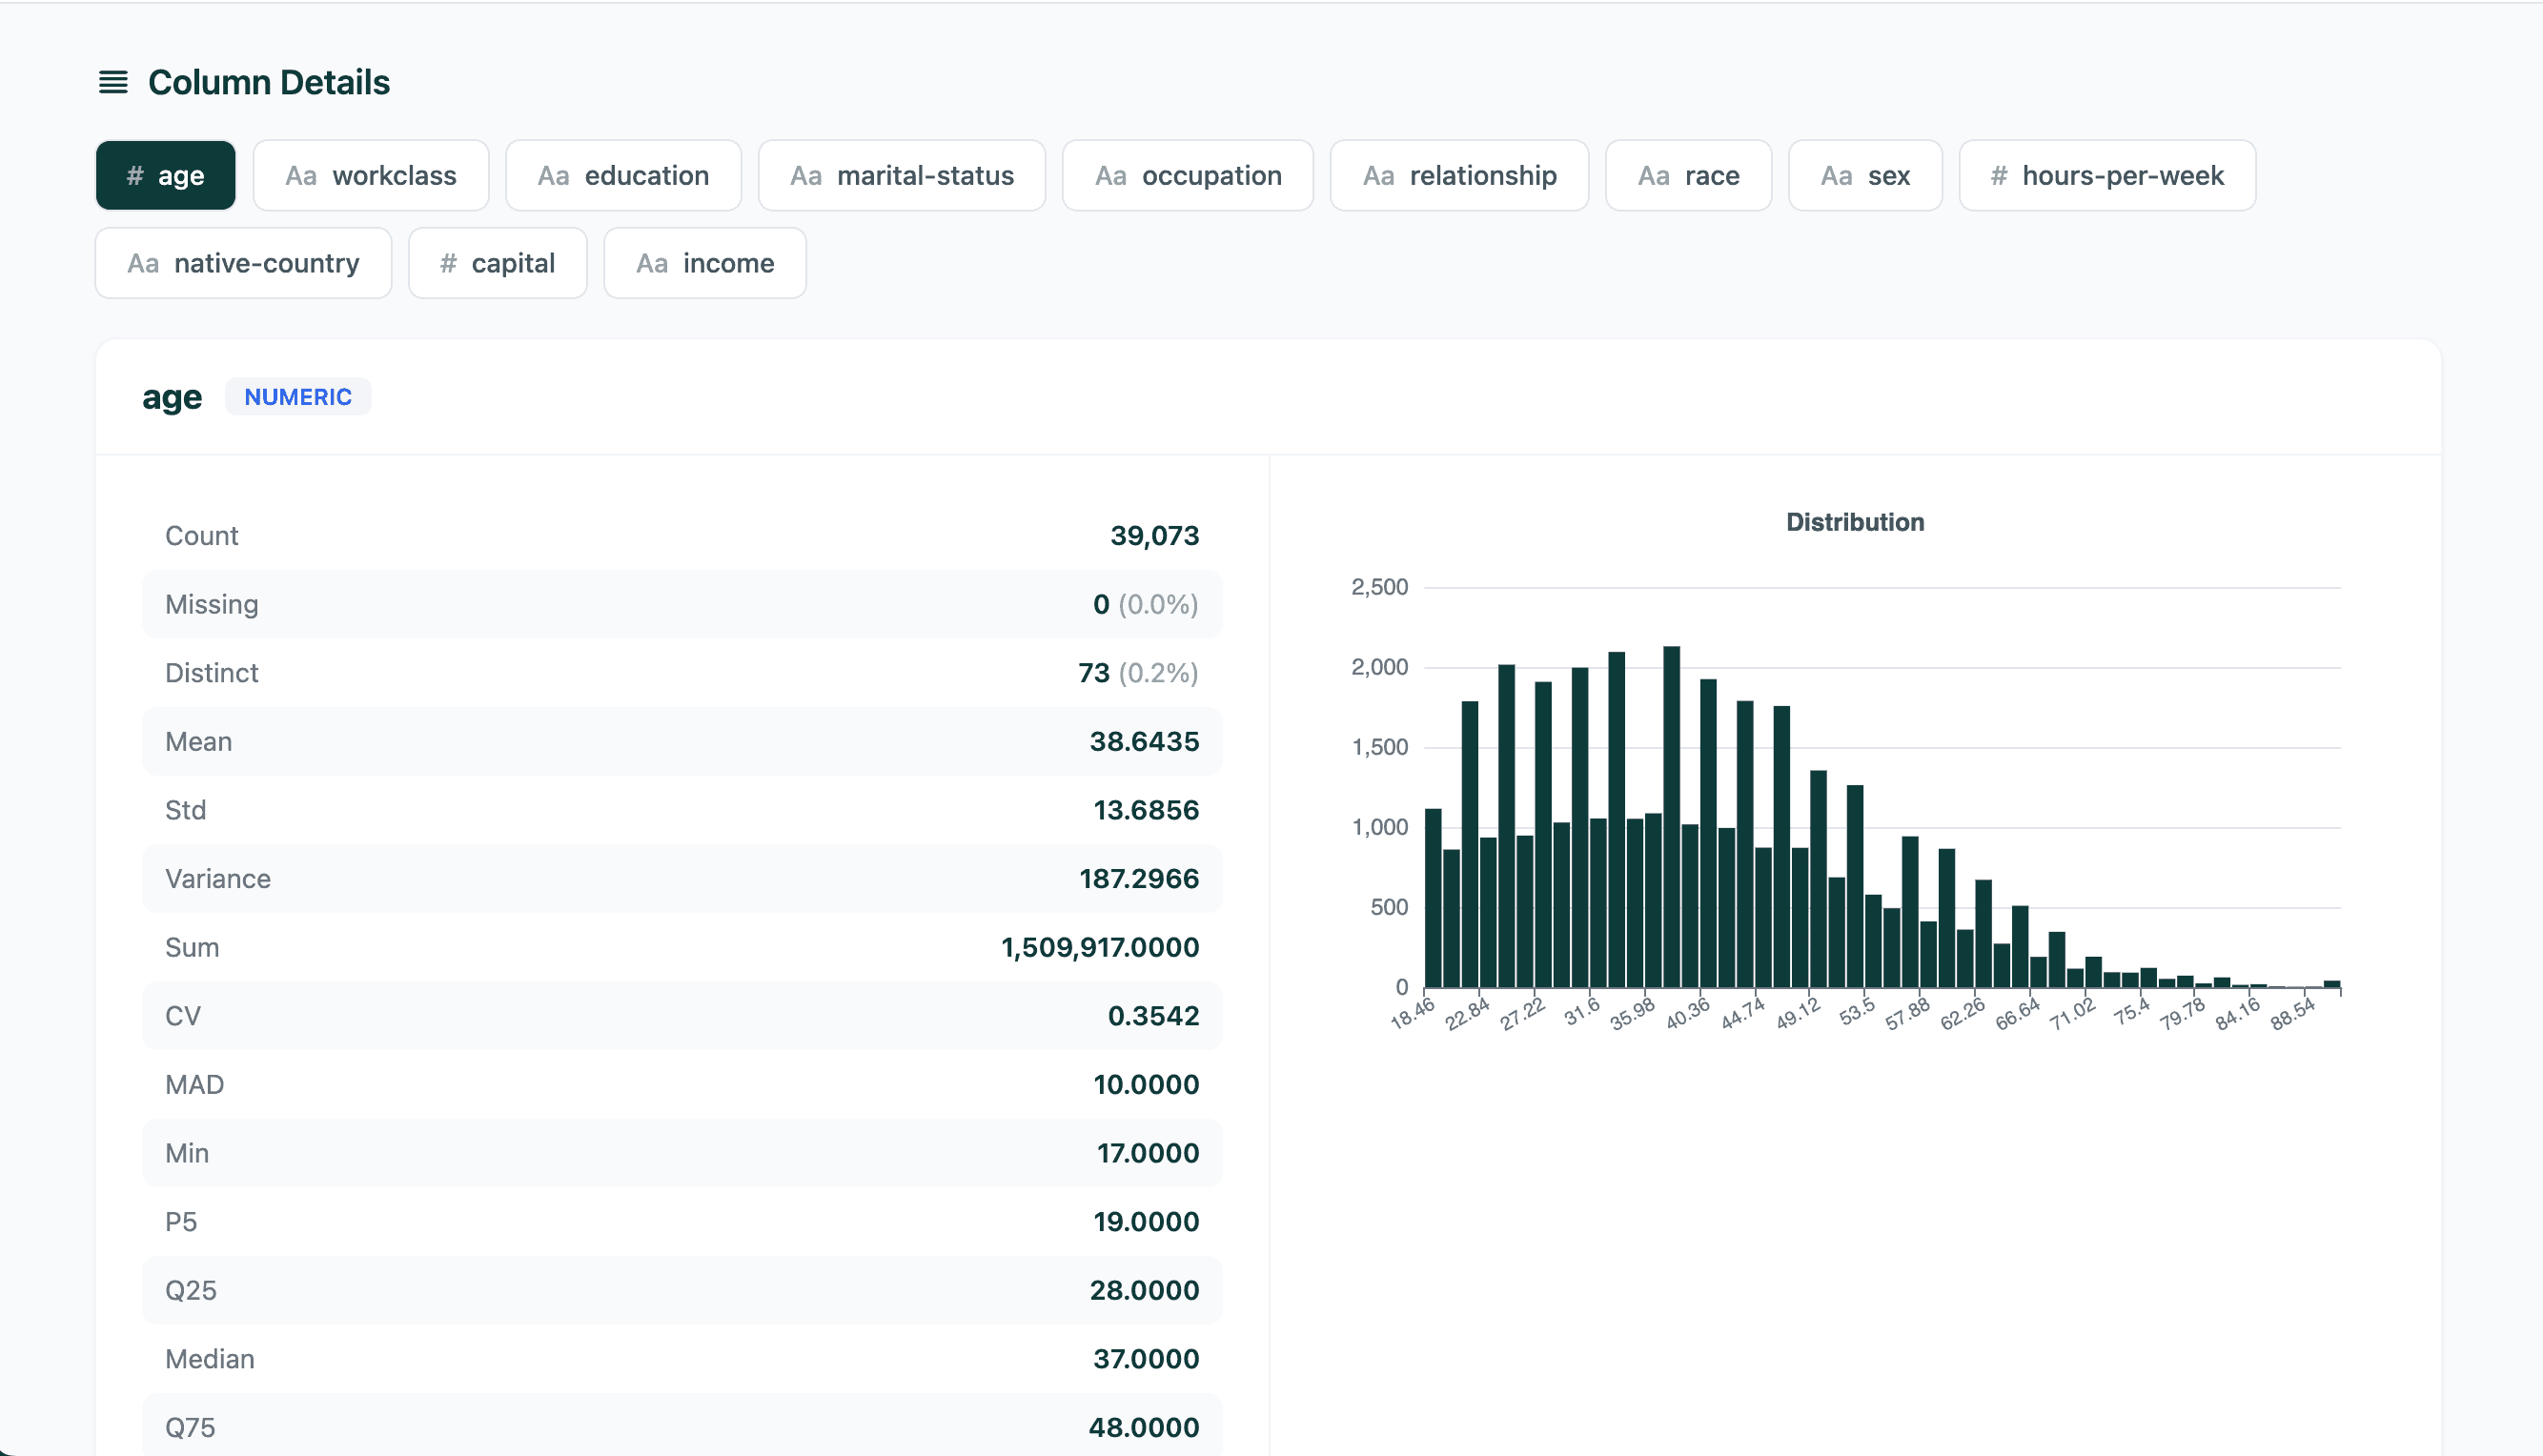
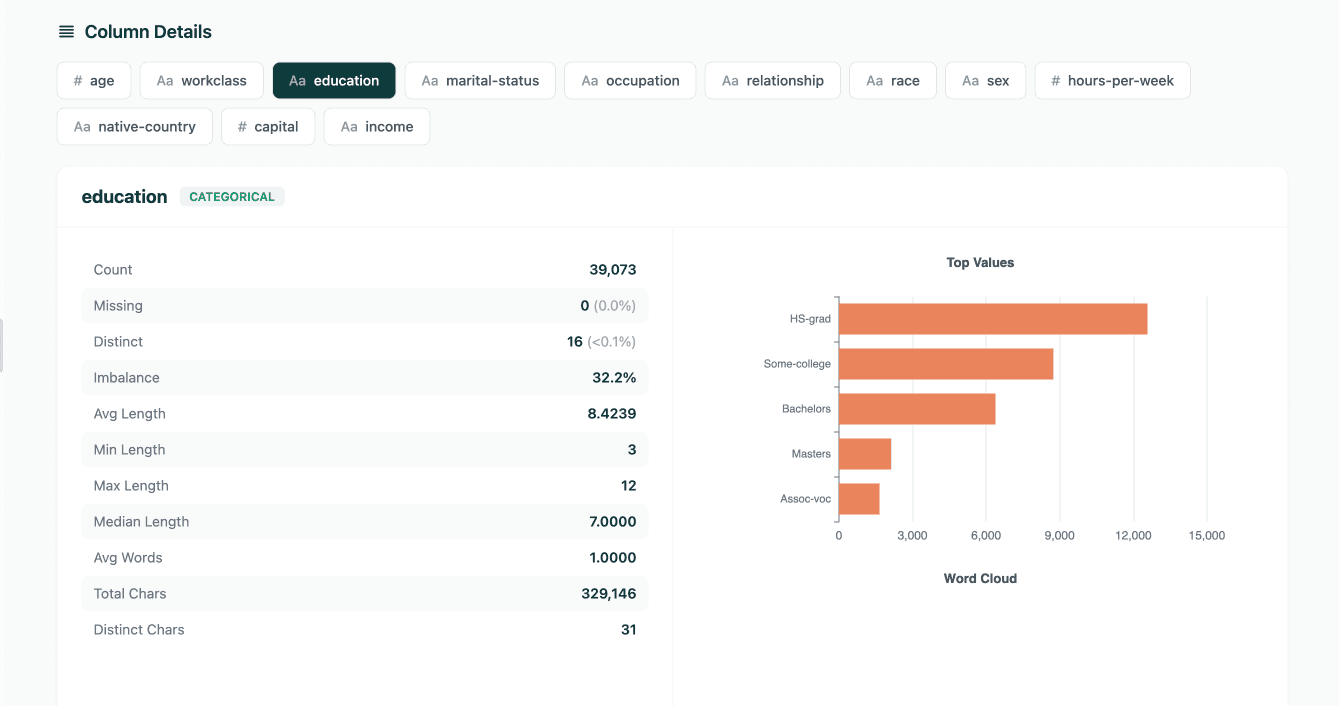
Five column types, each with the statistics that make sense for it — around thirty metrics for a numeric column, and a completely different set for a categorical one.
- Numeric: mean, std, variance, CV, MAD, quartiles, p5 and p95, skewness, kurtosis, monotonicity, zeros, negatives, infinities, histogram
- Categorical: imbalance, length statistics, character analysis, and top values with a remainder bucket
- Boolean, datetime, and text each get their own smaller set
Correlations that cross types
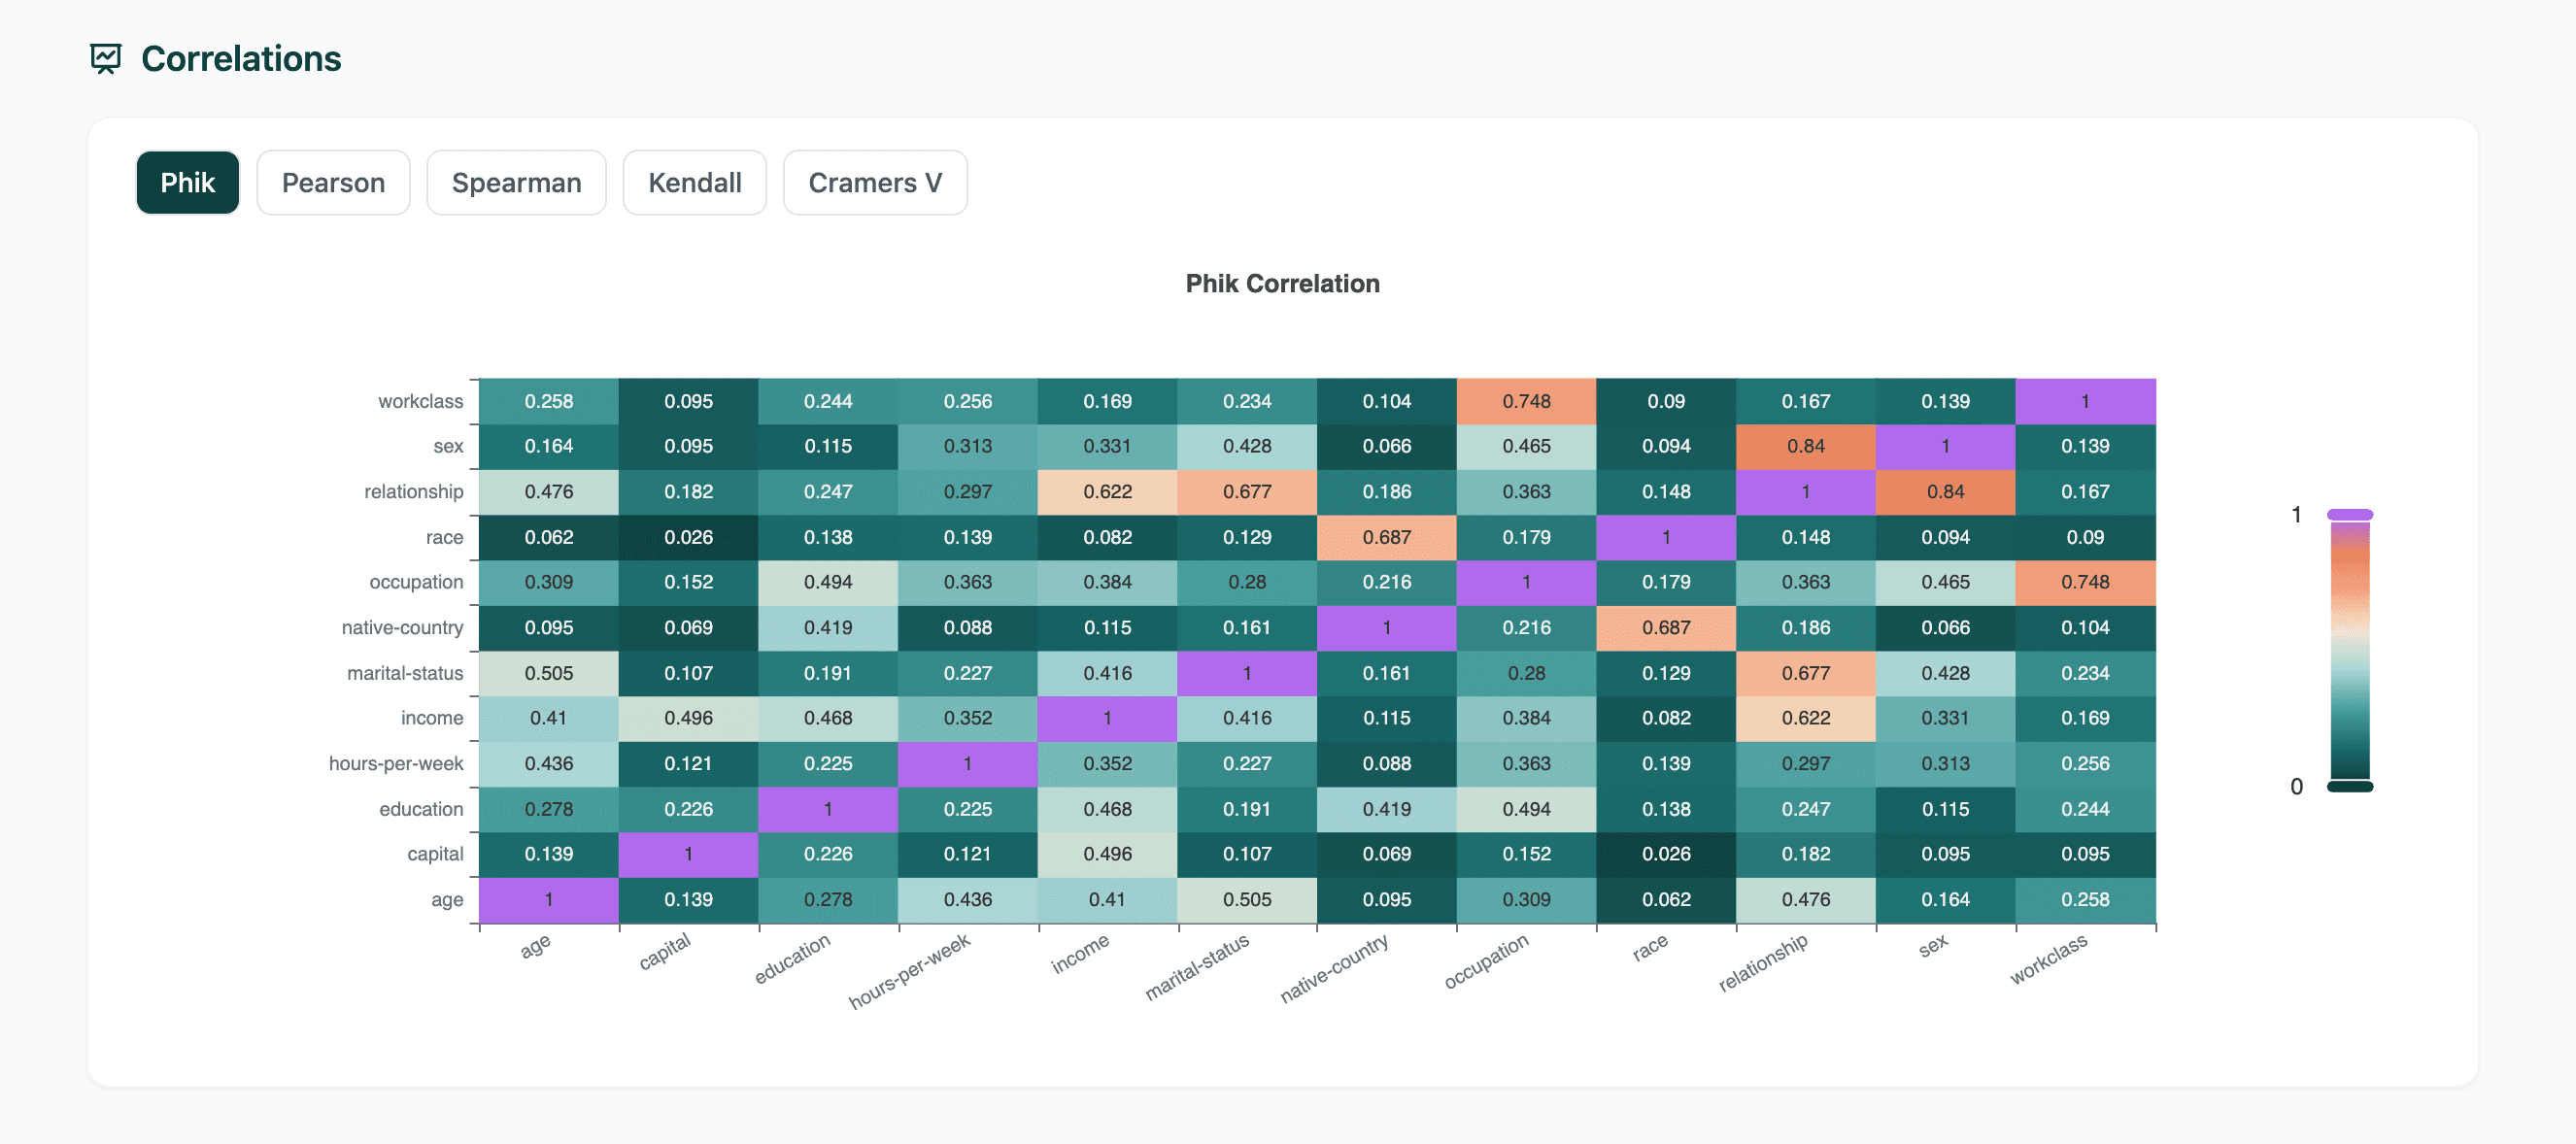
Pearson, Spearman, and Kendall for numeric pairs. Cramér's V for categorical pairs. Phi-K measures both in a single matrix — most tools stop at numeric.
- Phi-K covers numeric and categorical columns together, in one matrix
- Pearson and Spearman run in a Rust plugin; Kendall uses the tau-b implementation from SciPy
- Pearson, Spearman, and Kendall report p-values alongside the coefficients
Problems surface before you go looking
Nine checks run on every profile. The defaults are published below, and every one of them is a config field you can change.
| Alert | Scope | Default |
|---|---|---|
| HIGH_MISSING | any column | missing > 5% |
| CONSTANT | any column | distinct ≤ 1 |
| HIGH_CARDINALITY | numeric, categorical | distinct > 95% |
| HIGH_ZEROS | numeric | zeros > 5% |
| SKEWED | numeric | |skewness| > 2.0 |
| IMBALANCED | categorical, boolean | top value > 90% |
| UNIFORM | categorical | chi-square GOF p > 0.05 |
| HIGH_CORRELATION | column pair | |correlation| > 0.8 |
| DUPLICATES | dataset | any duplicate row |
from dataxid_profiling import ProfileReport, ProfileConfig

config = ProfileConfig(
    missing_threshold=0.1,
    skewness_threshold=1.5,
    correlation_threshold=0.9,
)

report = ProfileReport(df, config=config)

for alert in report.alerts:
print(alert.column, alert.alert_type.name, alert.value)Polars all the way down
Every computation happens in Polars, with correlations and chi-square tests running in a Rust plugin. Pandas is an input adapter, not a dependency.
- Correlations and chi-square tests run in polars-statistics, a Rust plugin
- Pandas never enters the hot path — it is not a declared dependency
- Two modes trade depth for speed
| Feature | complete | overview |
|---|---|---|
| Column statistics | included | included |
| Histograms and value counts | included | included |
| Correlations | included | not included |
| Interactions | included | not included |
| Character analysis | included | not included |
| Duplicate row sample | included | not included |
One file, no server
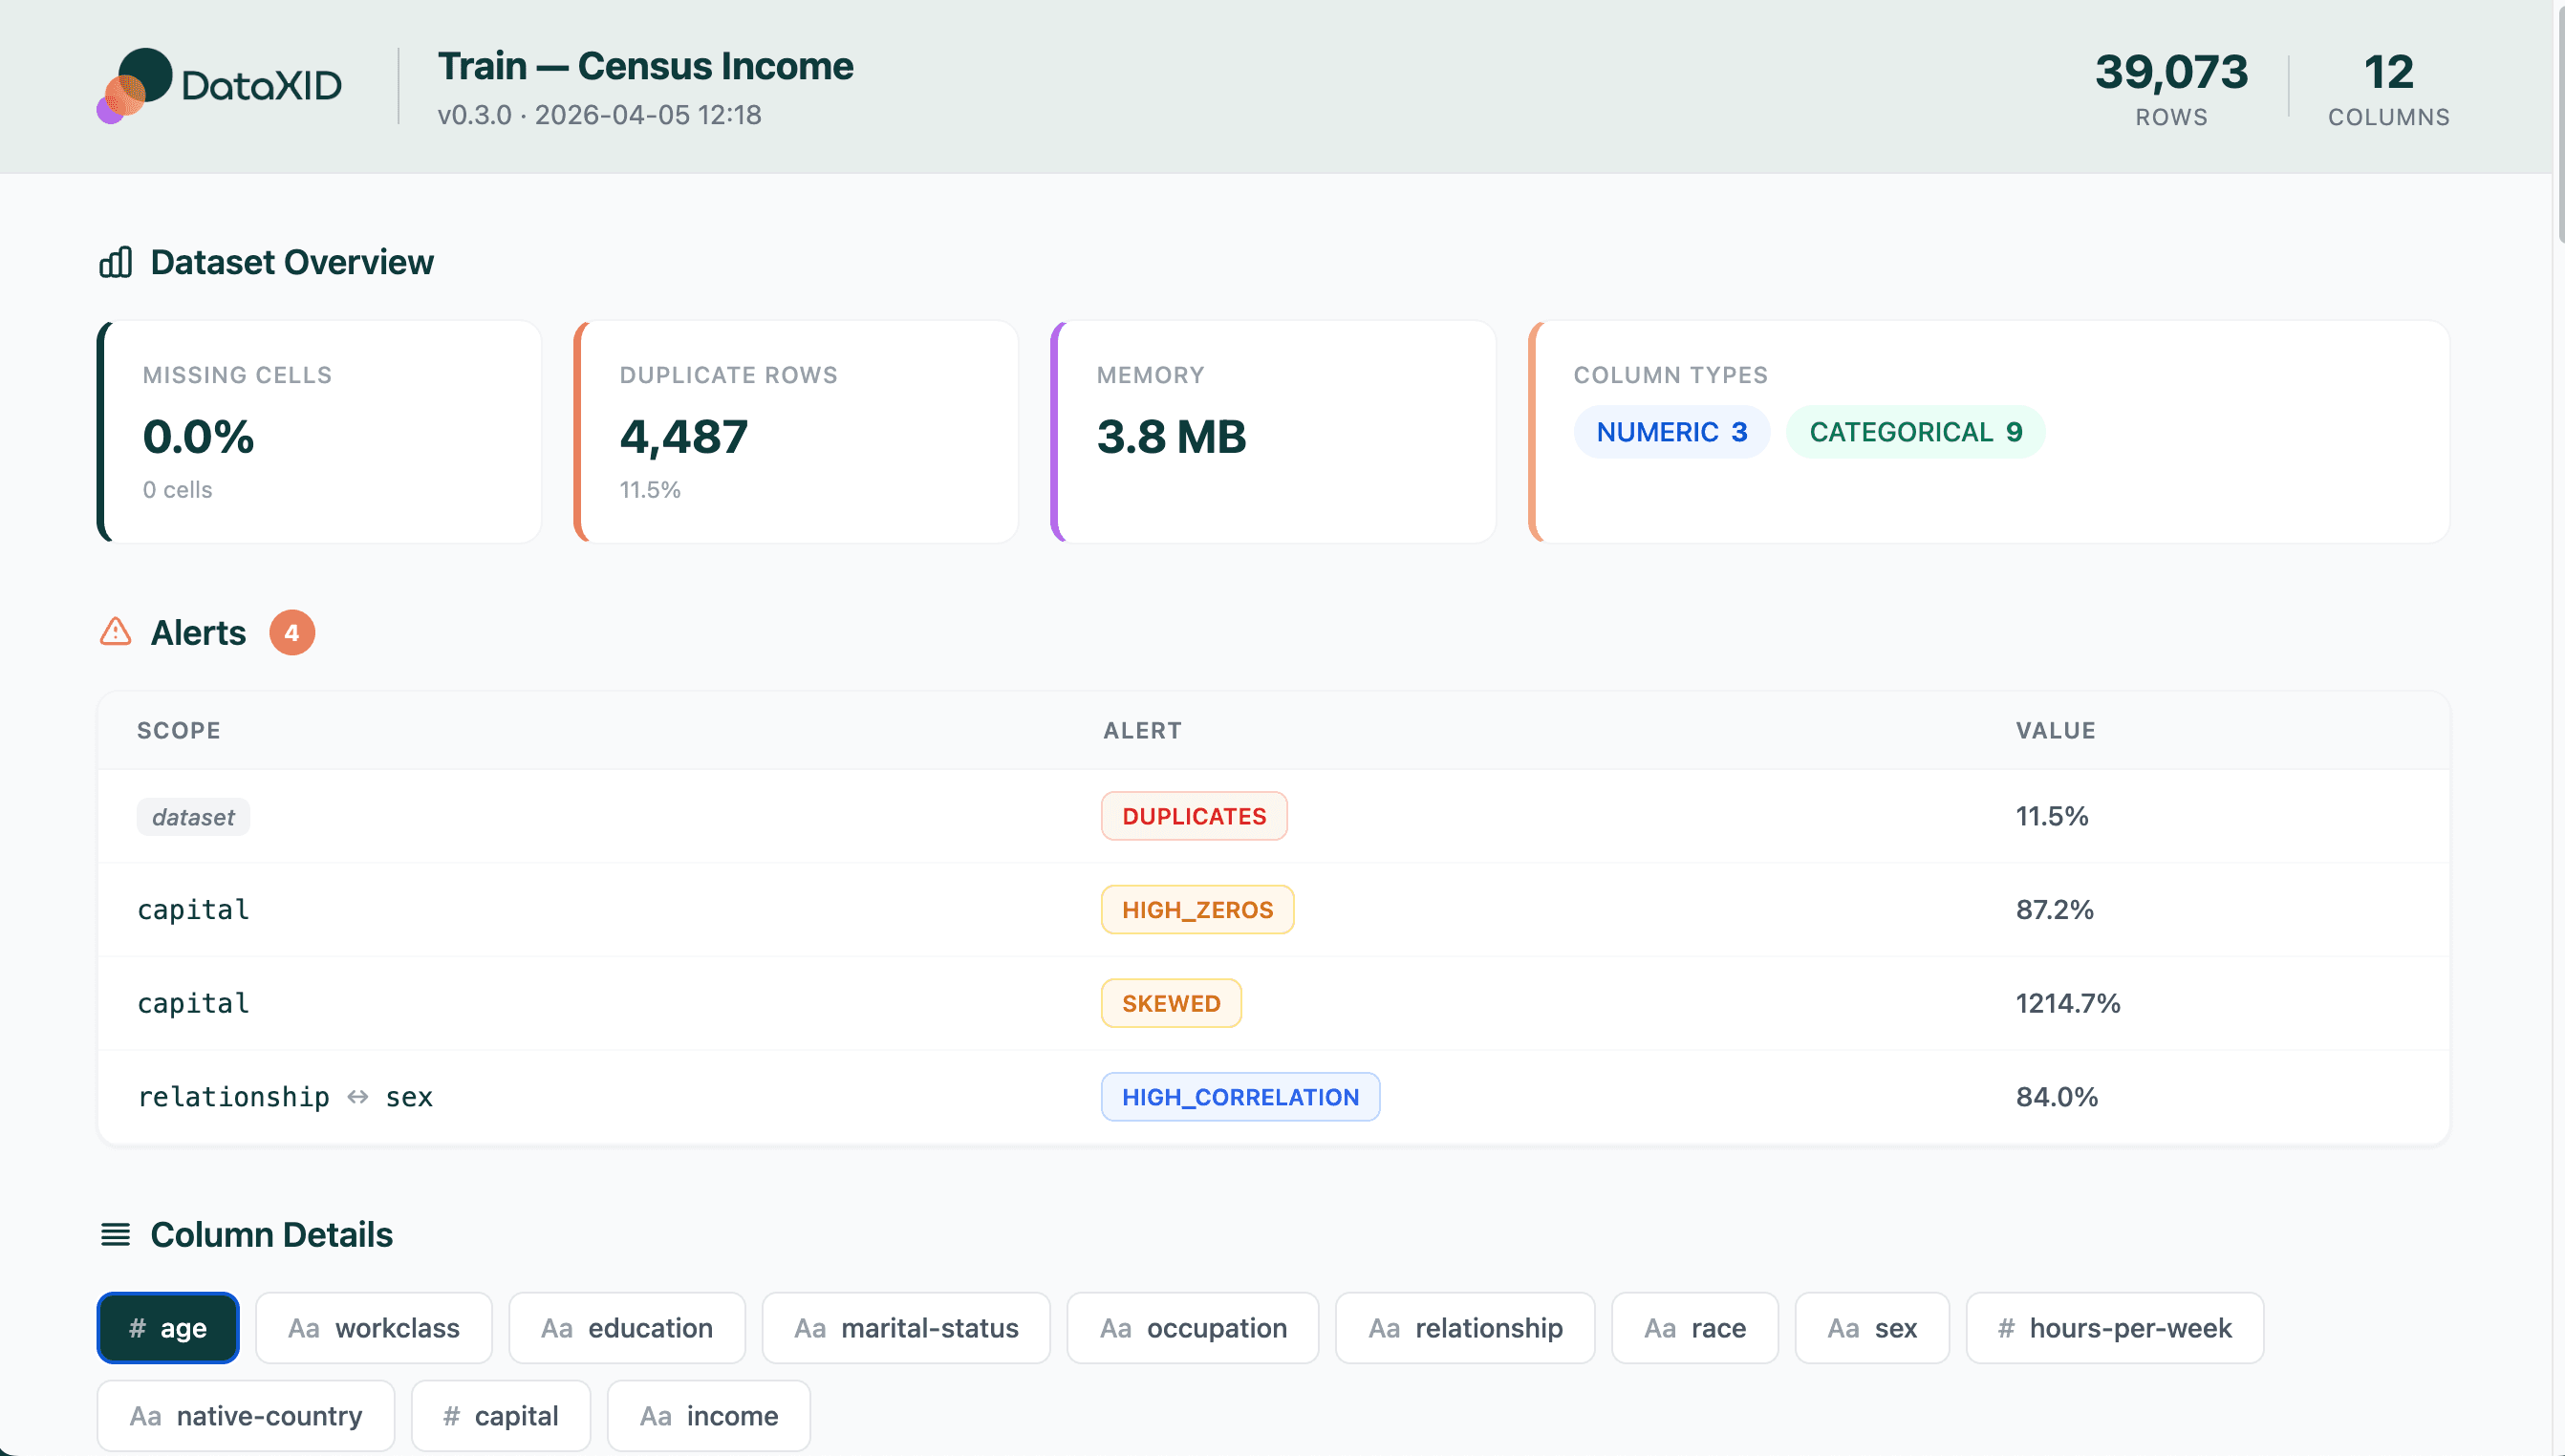
to_html writes a single self-contained file with interactive charts. Email it, commit it next to the data, open it on a plane.
- Interactive charts, rendered with ECharts
- No server, no build step, nothing to install at view time
- The same result also serializes to JSON and to a plain Python dictionary
Three lines, any input, fully typed
Point it at a Polars frame, a pandas frame, or a path on disk — the call is the same. Config is a frozen dataclass that validates on construction.
- Accepts Polars DataFrame and LazyFrame, pandas DataFrame, and .csv, .tsv, or .parquet paths
- ProfileConfig validates thresholds when you build it, so an invalid value fails immediately instead of silently
- py.typed ships in the wheel, so editor completion works on every return value
- Apache-2.0, Python 3.10 and up
# a Polars frame
ProfileReport(pl.read_parquet("events.parquet"))

# a pandas frame
ProfileReport(pd.read_csv("customers.csv"))

# or just a path
ProfileReport("data/transactions.csv")
Profile your own dataset
Install it, point it at a CSV, and read the result in code.
pip install dataxid-profiling