
Know what your synthetic data keeps—and what it reveals
dataxid-syntheval compares original and synthetic side by side — distributions, relationships, alerts — then hands back typed fidelity and privacy scores you can assert on, plus an interactive HTML report.
pip install dataxid-syntheval- PyPI
- Apache-2.0
- Python 3.10+
import polars as pl
from dataxid_syntheval import SynthEval

original = pl.read_csv("original.csv")
synthetic = pl.read_csv("synthetic.csv")

se = SynthEval(original=original, synthetic=synthetic)
se.to_html("report.html")Start with the comparison that matters
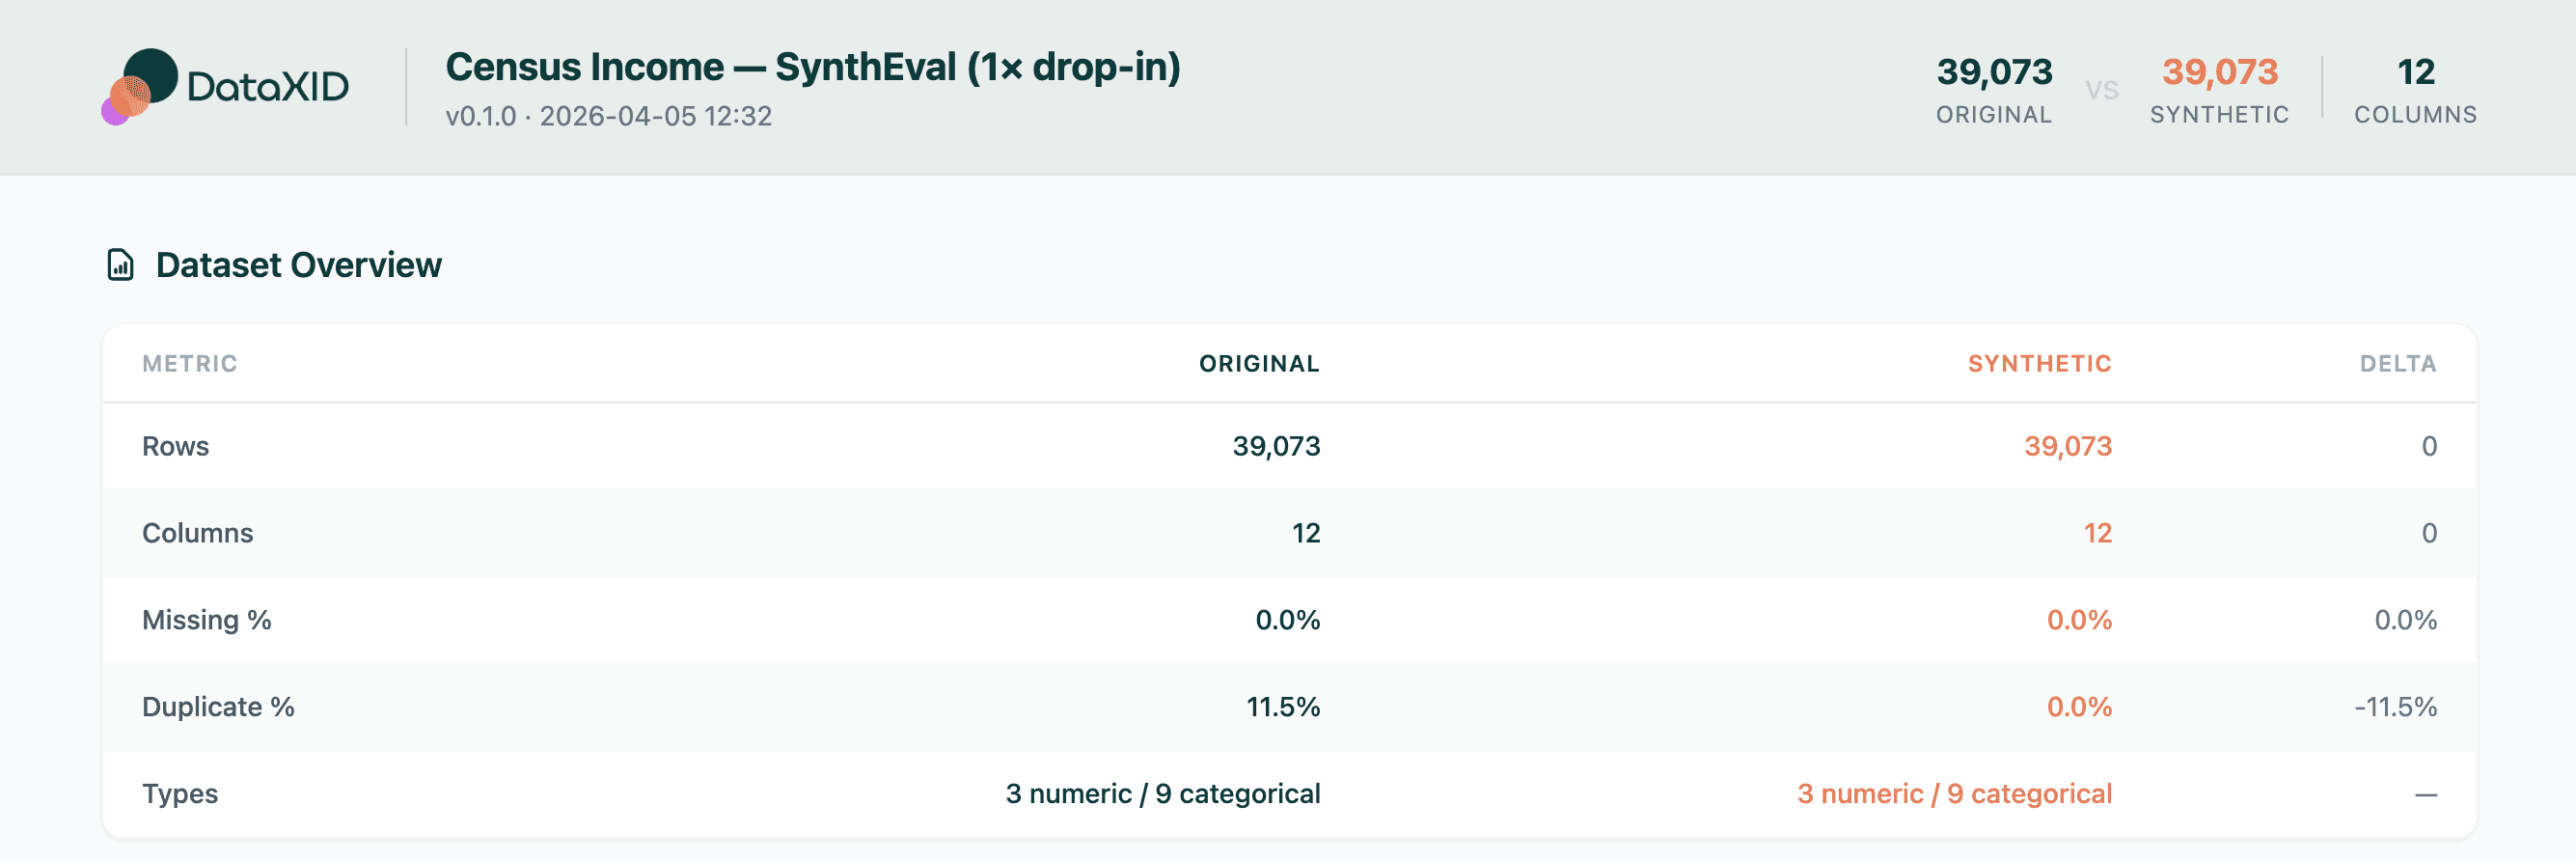
Rows, missingness, duplicates, and types — original versus synthetic, with an explicit delta on every row.
Compare distributions, not assumptions
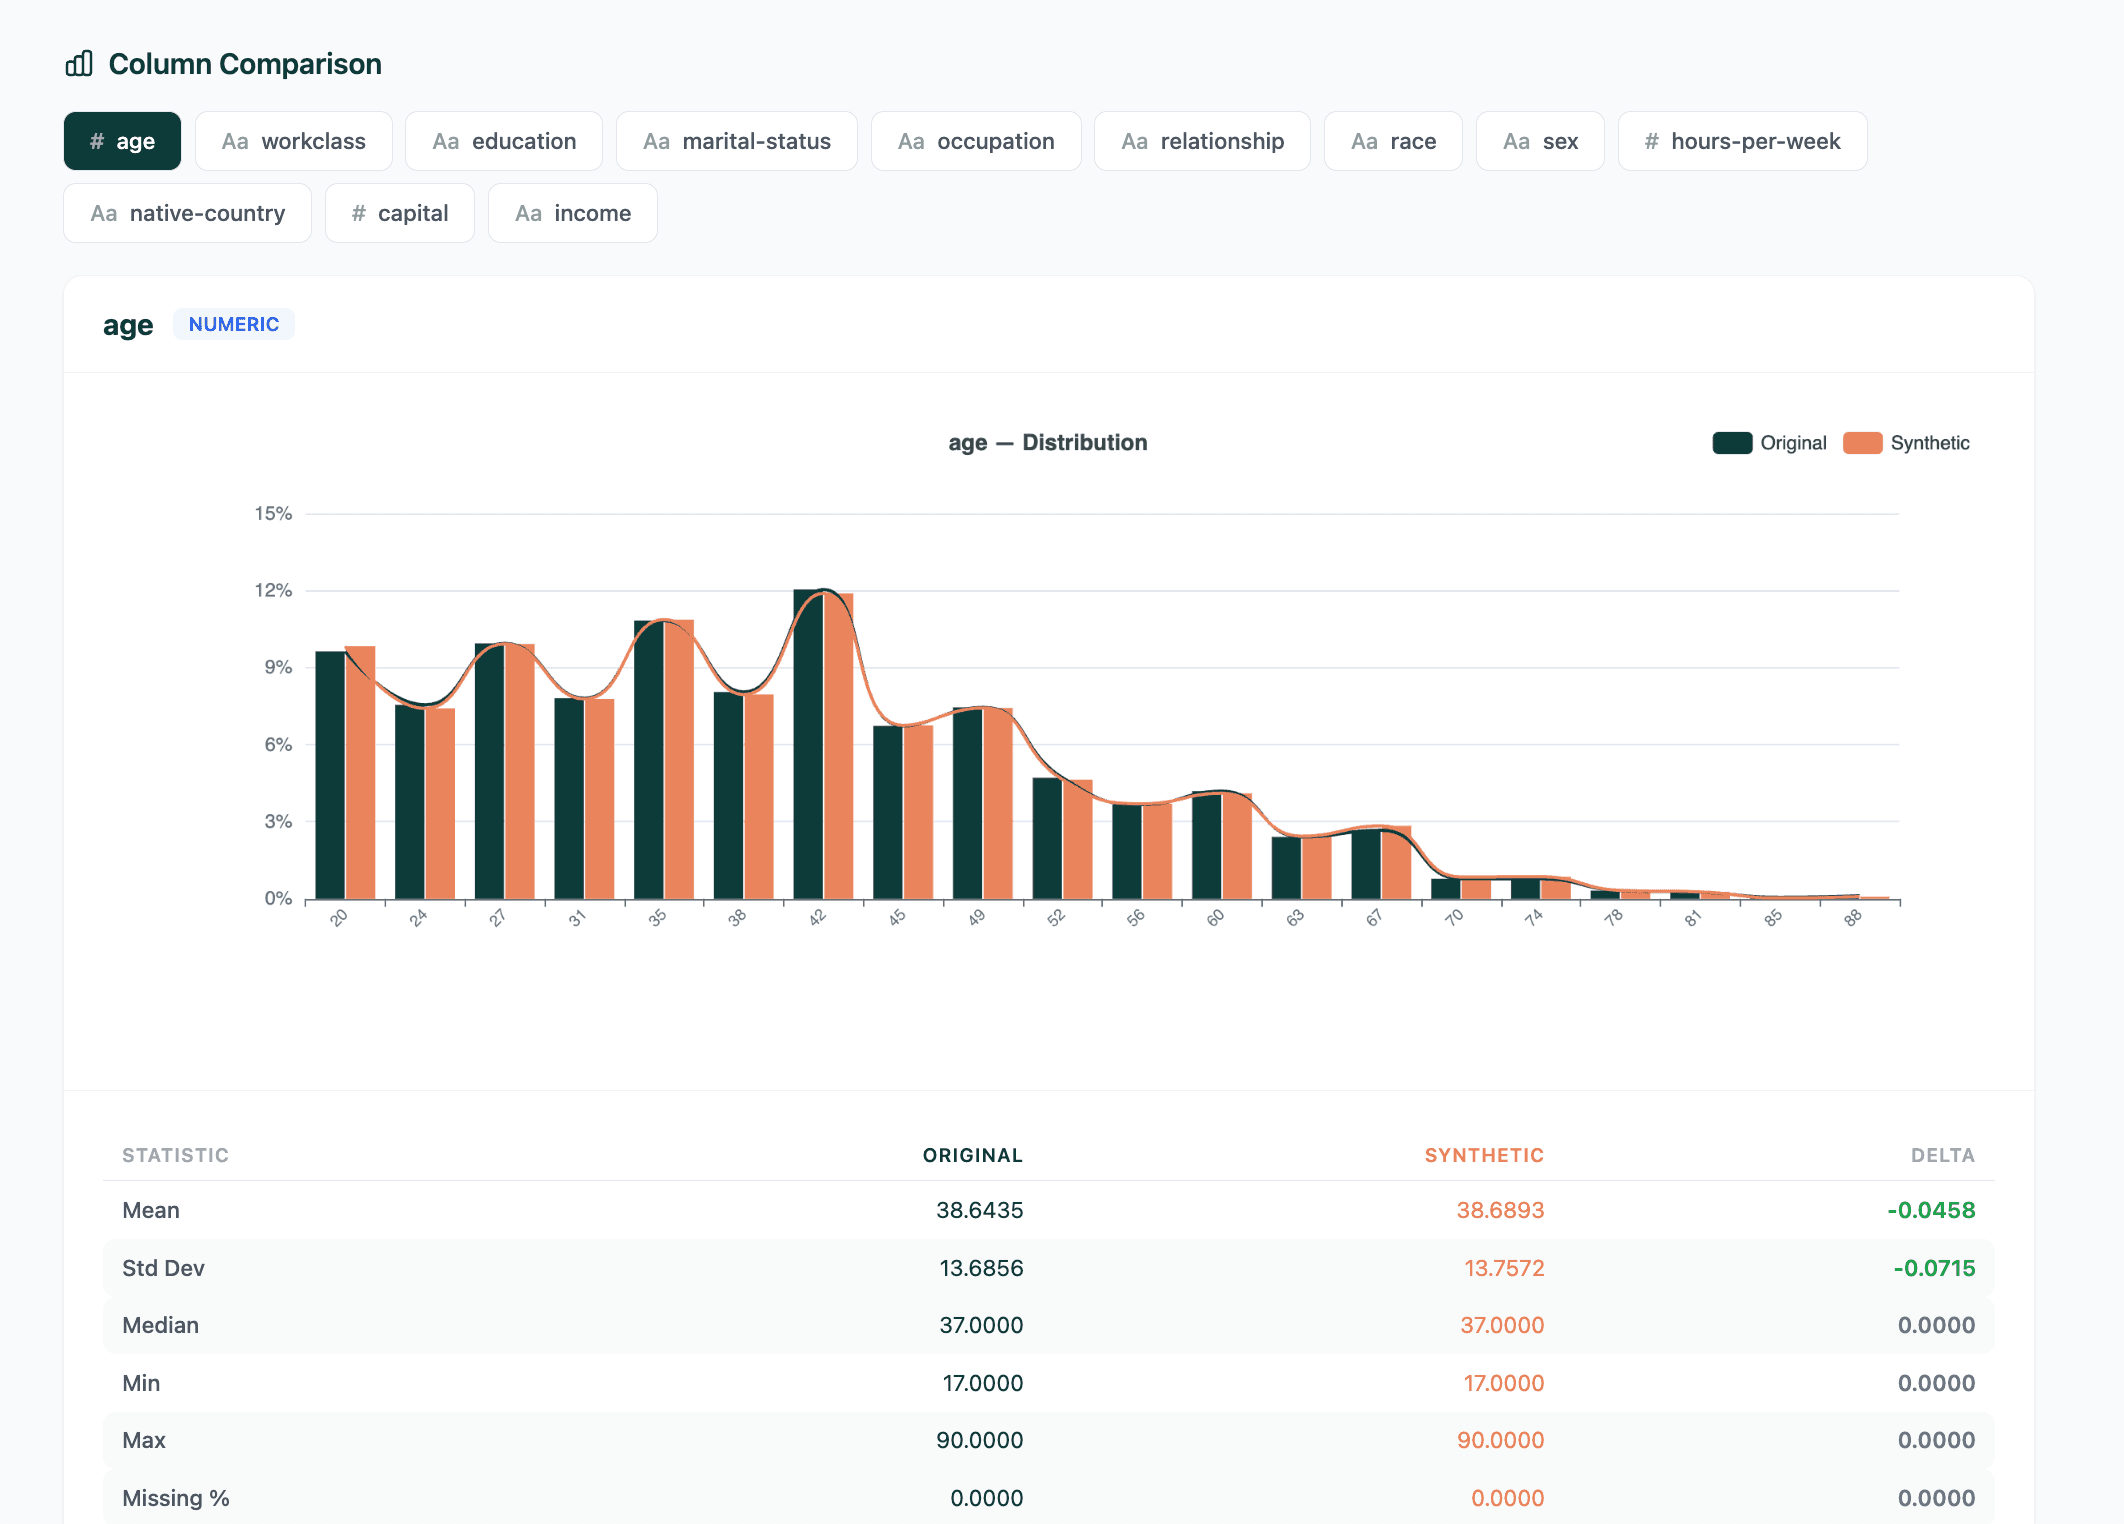
Proportion-based overlays keep different row counts honest. Every shared column gets original, synthetic, and a typed delta table.
- Numeric columns re-bin into a shared overlay so shapes are comparable
- Categorical overlays align top values and an explicit Other bucket
- Column diffs expose mean, std, missing %, imbalance, and more as Python values
Relationships, side by side
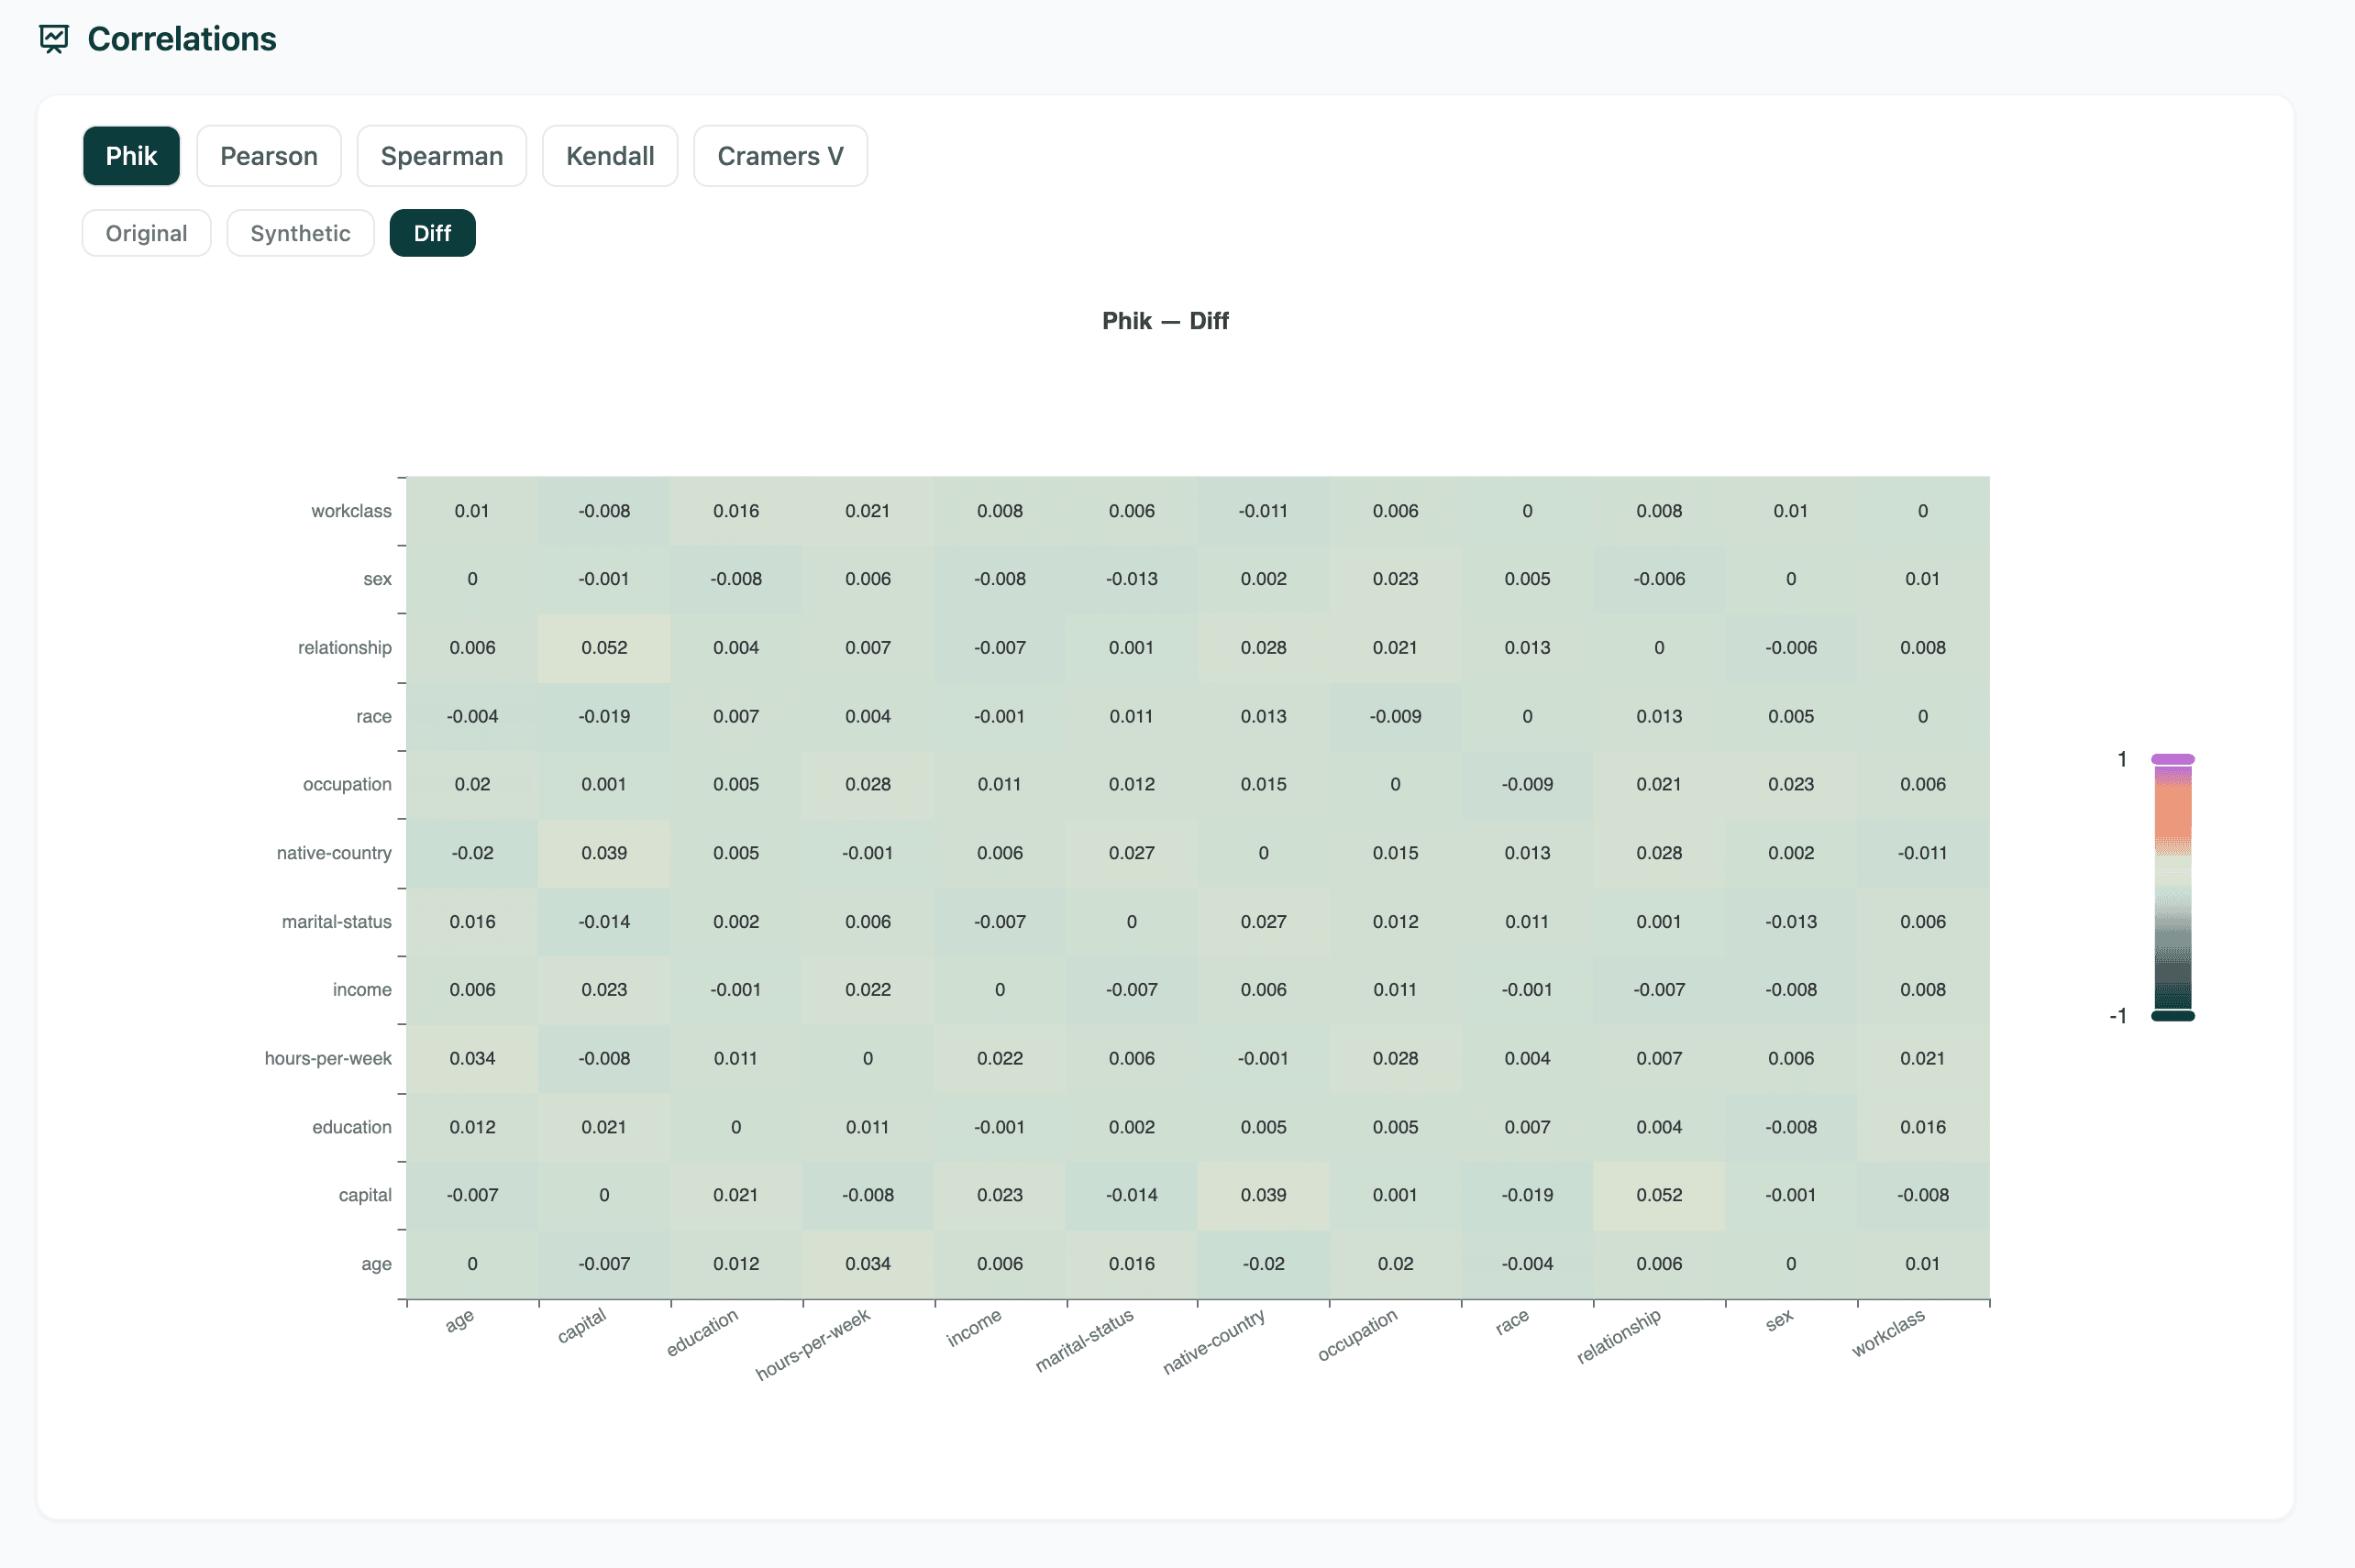
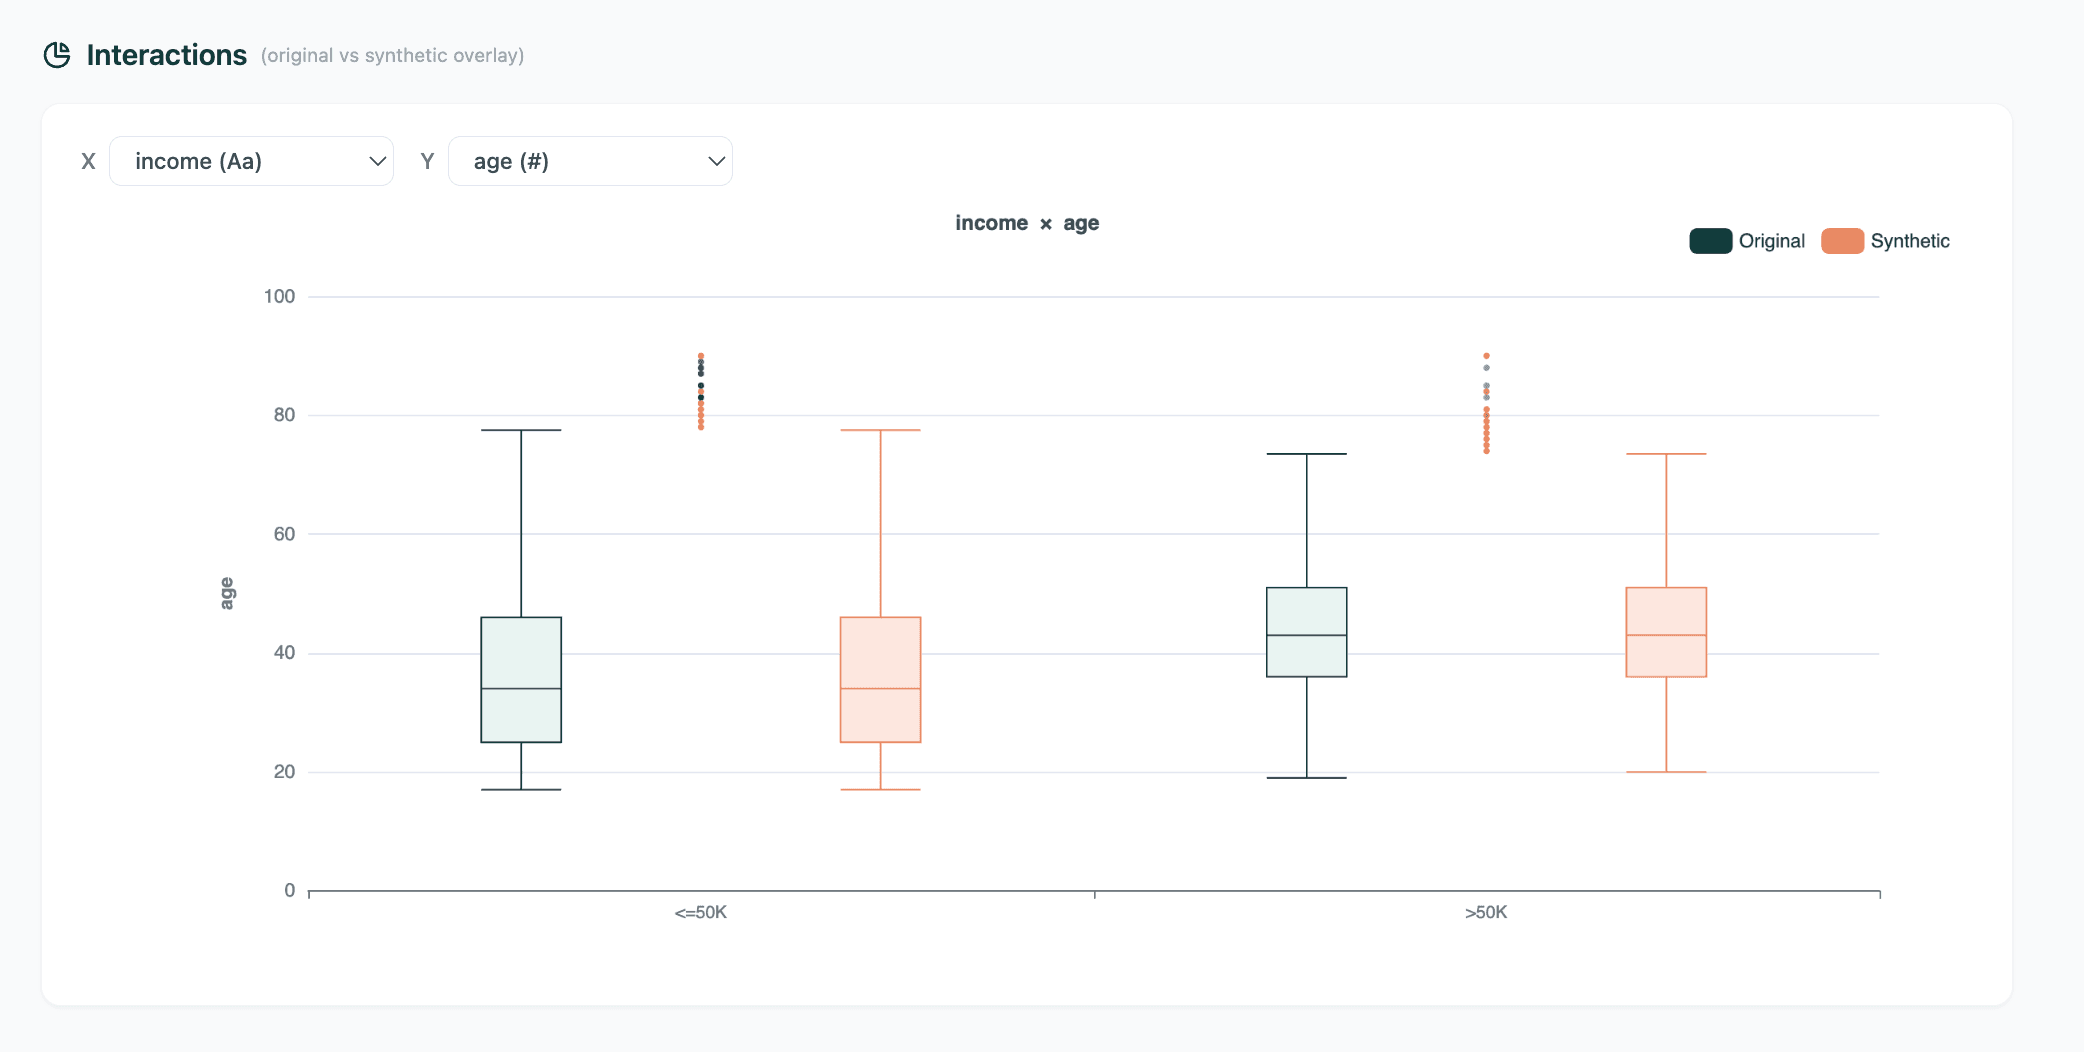
Correlation matrices for original, synthetic, and their difference — plus interaction overlays for the pairs you care about.
- Phi-K, Pearson, Spearman, Kendall, and Cramér's V — Diff tab shows original − synthetic
- Scatter and box-plot overlays for numeric and categorical × numeric pairs
- Built on the same profiling engine, so the matrices mean the same thing upstream
Scores with the evidence behind them
Fidelity and privacy are computed as typed Python values. The HTML report shows the visual diff; the scorecard is what se.scores returns — the same surface the platform reads.
- Fidelity is mean univariate and bivariate accuracy from total variation distance — (1 − TVD) × 100
- Per-column fidelity is available on scores.fidelity_detail.per_column
- Privacy (DCR share, IMS, NNDR) requires a holdout frame; without it, scores.privacy is None
- Assessments are diagnostic text, not a certification
se = SynthEval(
    original=train,
    synthetic=synthetic,
    holdout=holdout,
)

scores = se.scores
scores.fidelity
scores.fidelity_detail.univariate
scores.fidelity_detail.bivariate
scores.privacy.dcr_share
scores.privacy.ims_training
scores.privacy.nndr_ratioThree lines, two inputs, typed output
Point SynthEval at Polars frames or existing ProfileReport objects. Diffs and scores are lazy properties — compute once, read many times.
- Accepts pl.DataFrame or ProfileReport for original and synthetic
- Holdout is a Polars DataFrame when you need privacy scores
- se.diff exposes overview, column diffs, alert changes, overlays, and correlation diffs
- py.typed ships in the wheel; Apache-2.0
from dataxid_profiling import ProfileReport
from dataxid_syntheval import SynthEval

se = SynthEval(
    original=ProfileReport(original_df),
    synthetic=ProfileReport(synthetic_df),
)

diff = se.diff
diff["alert_diff"]
diff["distribution_overlays"]
Evaluate your own synthetic data
Install it, pass original and synthetic frames, and read the result in code.
pip install dataxid-syntheval